Service Insights (SI) is part of the Particular platform designed to provide a
Complete under-the-hood visualization of a system’s behaviour
Unfortunately, we’ve run into a situation when the tool fails to deliver visibility, creating a needle in a haystack situation when trying to troubleshoot what has happened. Here’s a scenario to provide the context.
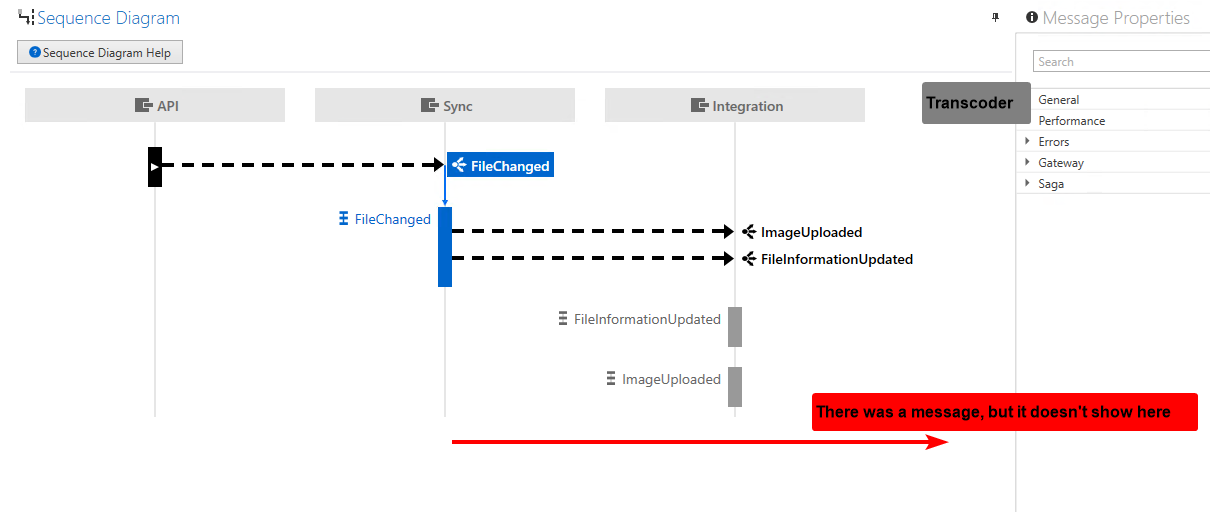
There are two endpoints. Sync and Transcoder. The Sync endpoint is responsible for raising an event to let the Transcoder endpoint perform a media file processing. Transcoder kicks in when Sync raises an event about a file that’s been handled. The issue is that some files cannot be transcoded at all. As a result, some files will fail (DRM problems, incorrect file types with a wrong extension, etc.). In that case, Transcoder throws an unrecoverable exception to avoid unnecessary retries.
A custom recoverability policy is defined for the Transcoder endpoint that instructs to discard erred messages caused by unrecoverable exceptions. There’s no point in sending those messages to the error queue - they cannot be processed no matter what. So NSB framework does the right thing. An event raised by Sync failed processing in Transcoder, and the message is discarded due to the exception being unrecoverable and the policy instructing to discard the failed message. Except the real world poses a challenge. SI, when used to understand what happened, is absolutely blind and clueless to what took place. From SC’s perspective, it never saw the event from Sync to Transcoder because it never hit the audit or the error queue. But, as a prod-ops, you’d really want to know that information. And if it feels like there’s a gap that needs to be filled to allow troubleshooting in production, see a message that was published, received, attempted for processing, failed as unrecoverable, and eventually discarded.
It would be great to see SI providing the necessary visibility.
Example: