I recently installed ServiceControl and ServicePulse to be able to use the error and retry functionality. Before that we had metrics about the length of the error queues per service on our grafana dashboards. We did that by gathering metrics about queues directly from RabbitMq via a Prometheus scraper. Because we now move all errors to the same queue that is immediately consumed by ServiceControl, we do no longer have this metric available.
We’d really like to continue to have a top level overview of our services in grafana. Is there a way to get the amount of errors to review as metric from ServicePulse/ServiceControl? Either by a prometheus exporter or directly by some grafana plugin or similar?
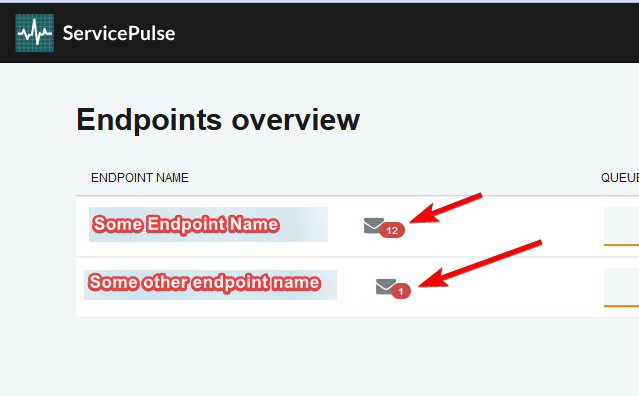
The only data I’m interested in, currently, is this:
I was just Googling for this exact same thing which led me here. I would be interested in ServiceControl pushing metrics to Prometheus as well.
I am in the process of working this example into our implementation to see frequency of errors moved to the error queue and retries so we can alert on these values, but when we start relying more heavily on NSB and errors become more important to deal with rather than discard, I think relying on ServiceInsight as the hub for failed message handling could be important for us, unless there are any plans to recreate the failed error handling experience as a Grafana dashboard?