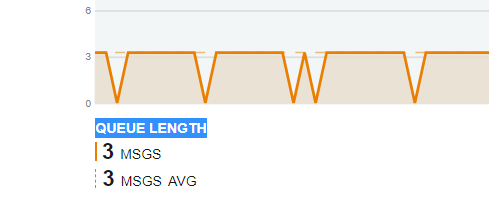
When I debug a NServiceBus endpoint hosted in a .NET Core 3.1 application the handlers are sometimes not fired and nothing is logged to the console output but I do see a weird dip in the queue length of the monitoring tool:
Starting and stopping VS sometimes helps. Is this a known feature? 
What transport are you using? Some transports like Learning &SQL Server use Polling to check for messages, which means they actively look for new incoming messages at a fixed interval and then process them. This interval is configurable through the transport configuration in code.
We are using AzureServiceBus transport.
Starting and stopping VS sometimes helps. Is this a known feature?
No it is not ![]()
From the top of my head, when a message is in the queue
- It can be picked up and handed over the one or more message handlers
- It can be picked up and find there is no message handler, logging this and moving it to the error queue.
- It can be picked up and something in the NServiceBus pipeline throws an exception and the message is retried until it’s moved to the error queue
- It can be picked up and find there is no saga instance, logging this as info and remove the message from the queue
There might be other possibilities though. The saga is a specific one and intended one. It can be monitored more closely by implementing a SagaNotFound handler.
There is the possibility that you’ve set logging to a level that doesn’t report most errors or anything that NServiceBus provides. You can find ways to configure this here: Logging • NServiceBus • Particular Docs
If you’re still unable to figure out what’s happening, send an email to support@particular.net and mention my name. I’m Dutch and I think you’re as well, perhaps we can set up a call and resolve this.
Hoi Dennis
“It can be picked up and something in the NServiceBus pipeline throws an exception and the message is retried until it’s moved to the error queue” sounds very plausible, however I hooked up Log4net and I do see all the NServiceBus debug logging, but no error messages.
Maybe it’s unrelated but I also see strange stuff in ServicePulse:
The endpoint says it has 3 failed messages but when u click on them it says: “There are currently no message failures”
![]()
Hi Robert,
It’s unclear why all of that is happening. My first guess is that you’re expecting messages to arrive somewhere but they’re not and that’s why NServiceBus isn’t logging anything. Because nothing is happening.
I’d need to verify your NServiceBus configuration, the code to actually send the message and the queues you’re monitoring. Could you share that information here, including startup diagnostics file. Or send the information to support@particular.net ?
Thanks,
Dennis
Hi,
Could it be that the messages are locked by Azure service bus because of a previous debugging session that was killed in the middle of the handling?
Because if I wait long enough the messages are being handled
2020-11-27 17:11:13,851 DEBUG - [6] - [(null)] - Receiver Main is starting, listening to queue CarInsurance-Anva.
2020-11-27 17:11:13,871 INFO - [6] - [(null)] - Application started. Press Ctrl+C to shut down.
2020-11-27 17:11:13,871 INFO - [6] - [(null)] - Hosting environment: Development
2020-11-27 17:11:13,872 INFO - [6] - [(null)] - Content root path: C:\Git\Workspaces…
2020-11-27 17:14:27,527 DEBUG - [19] - [(null)] - Processing message type:
So that would only leave the strange dip in the monitoring tool unexplained but less important.
If you’re in the debugger session and not letting the endpoint run, no messages will not be processed and not metrics will be sent out.