We just started exploring the options of NServiceBus and are very positive about the product.
The test-setup we are currently using (1x publish endpoint, 1x consuming endpoint and RabbitMq as transport) is working, and we configured the publish endpoint with EnableCallbacks(). This is all working fine! Message are send and received correctly.
So the next step for us was exploring the features of ServiceControl, so we have configured our consuming endpoint to enable heartbeats and metrics (which requires to enable Auditing). And when looking at the metrics via ServicePulse, everything looks good and seems to be working.
But when I look in RabbitMq, the queue “xxx.Servicecontrol.Audit.Errors” (default name when installing it via ServiceControl) receives messages. And I have been looking/searching around, but couldn’t figure out why this is happening!
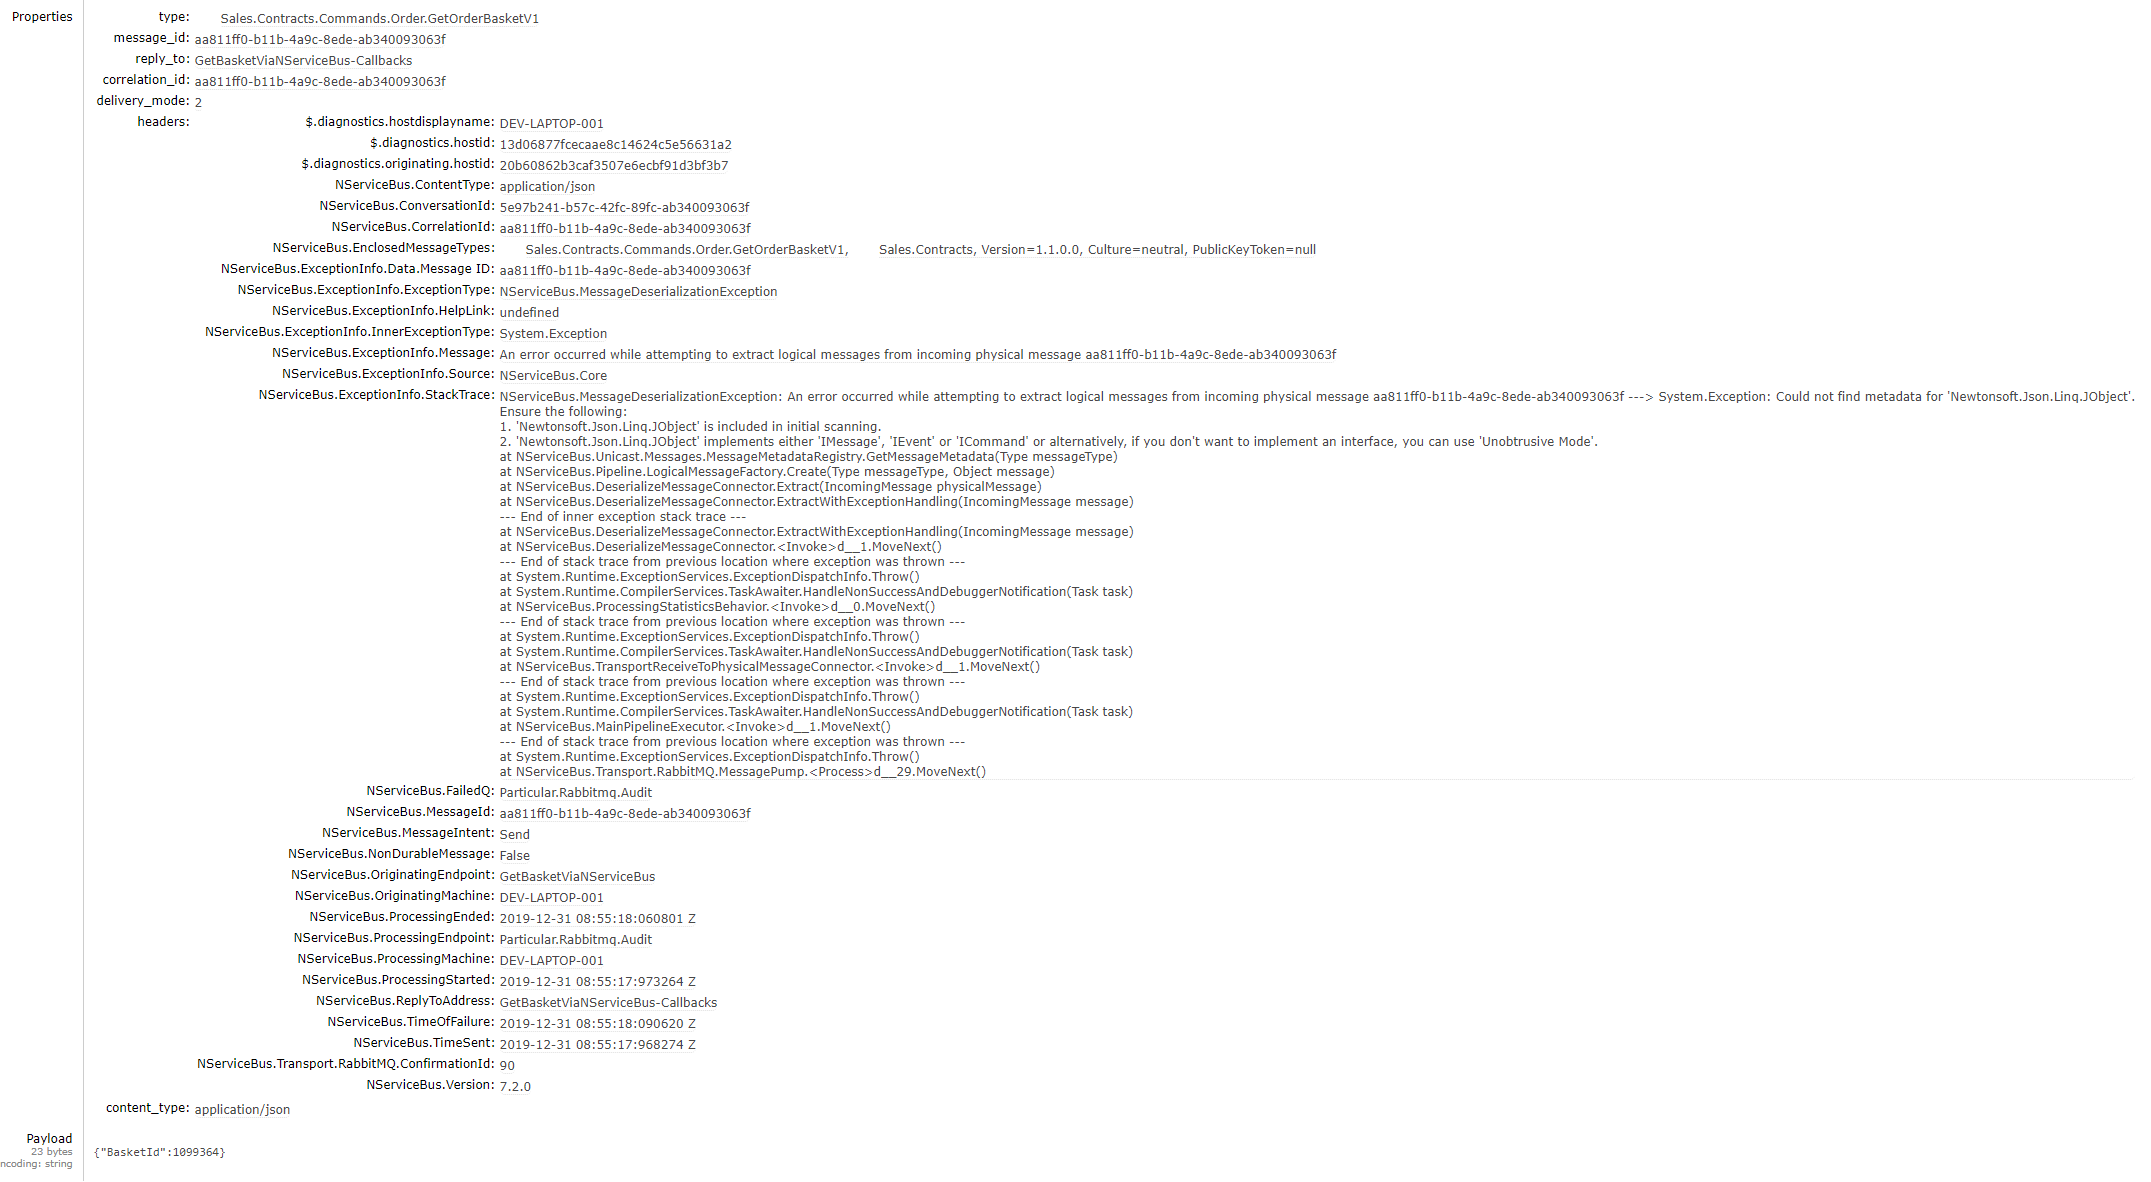
Attached the message which got in the Audit.Errors queue:
I have an feeling it has something to with the consumer of the “Particular.Rabbitmq.Audit” queue, which I believe is the audit instance running in ServiceControl. This instance doesn’t have any knowlegde of the messages which get on this audit queue, but how can I configure this instance in doing so (or isn’t this required?!).
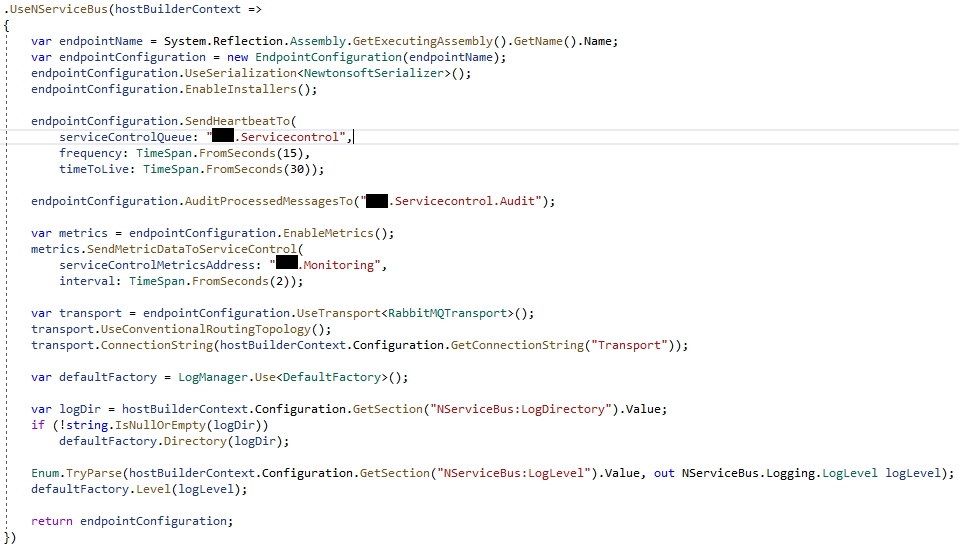
It looks like something is sending the GetOrderBasketV1 message to the Particular.Rabbitmq.Audit queue. Can you share your endpoint config? Specifically the part around the audit and failed messages. Can you also share the servicecontrol config for the audit and regular instance?
Naming things gets a bit tricky when the service names are so similar to the capability name (specifically calling things audit), so I wonder if the audit messages are going to the ServiceControl processing queue instead of the ServiceControl audit ingestion queue.
Side note: metrics and heartbeats do not require auditing to be enabled, you should be able to have metrics and heartbeats (although I think metrics is sufficient for 95% of use cases anyway and you can likely skip heartbeats)
The xxx.ServiceControl.Audit queue is the processing queue for that instance of ServiceControl. It’s used for things like coordinating scaled out instances and tracking retries and a few other things. It’s not actually the audit ingestion queue. These are separated so that incoming audit messages don’t prevent the regular operation of ServiceControl by drowning out the processing queue.
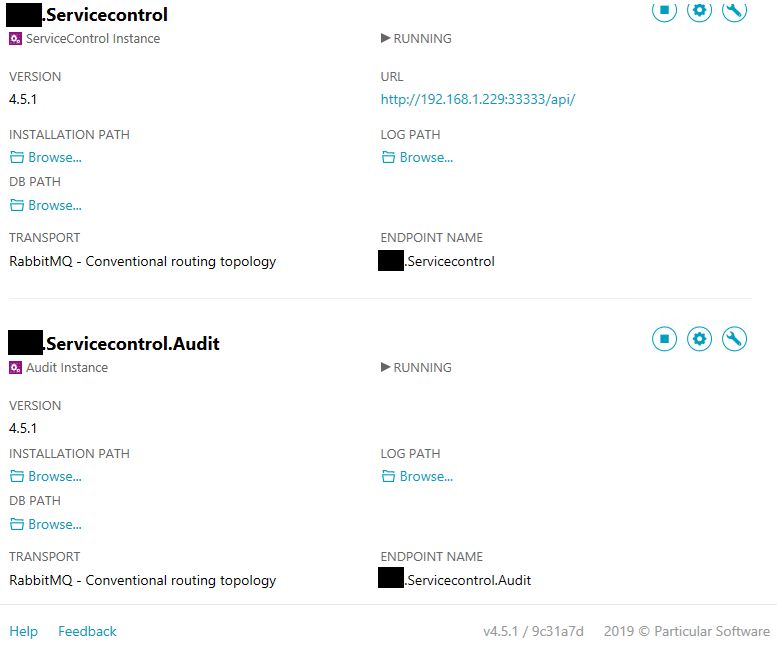
I would wager that the correct value there is endpointConfiguration.AuditProcessedMessagesTo(“audit”); as the default value for the audit queue is simply audit. In case you’ve changed that value though, you can see what it is by opening the config for the xxx.ServiceControl.Audit instance and scrolling all the way down and checking what value is written in the Audit Queue Name field. As I said, the default value is audit
Ok, I have checked the config and it is indeed “audit”.
Thank you for the explanation - I was already wondering why there were 2 audit queues
So after changing the consuming-endpoint configuration from “xxx.Servicecontrol.Audit” to “Audit” it is working like a charm. No more messages in error queues!
Thank you for the help, we will now continue exploring the features!