The second process in the chain is the Peek statement on that same queue
SELECT isnull(cast(max([RowVersion]) - min([RowVersion]) + 1 AS int), 0) Id FROM [scheduling].[Drive.Endpoints.Scheduling.Scheduler] WITH (READPAST, READCOMMITTEDLOCK)
And below that a number of processes trying to insert new messages into the queue.
I’m pretty sure this wasn’t happening before updating to latest Sql Transport.
Relevant endpoint configuration :
TransportTransactionMode Receive Only
Sql Persistence
Outbox Enabled
Single database for queues, outbox, business and persistence data
Endpoint is not scaled out.
We think we know from which company you are and it would probably be better to open an official support ticket for this, so we can communicate about setting up a call properly.
There are a lot of unknowns to us, so we feel it’s better to set up a call, if you’re okay with that. The current support team on rotation is all located in Europa, so we might have to hand this over to our Australian contacts, but we can discuss that further via email.
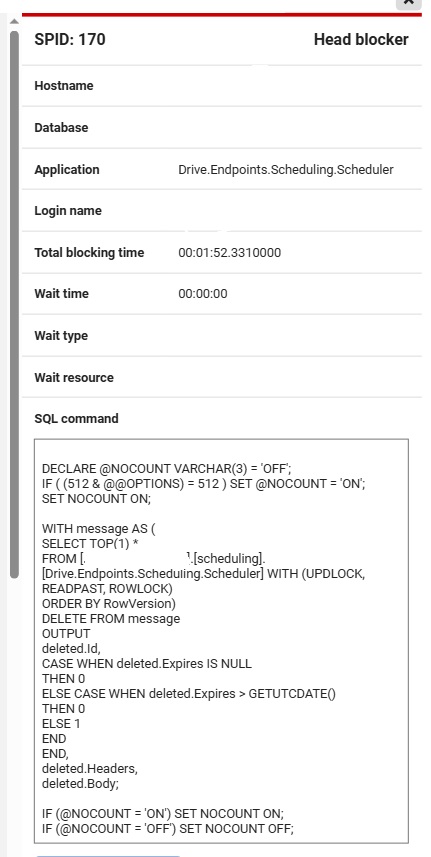
The long transaction you’re seeing isn’t abnormal. It could be that processing that single message takes time and keeps the transaction open. Once the handler is finished, the transaction should succesfully complete and the row is deleted.
It should not block anything else from working, because for example the peek query has READPAST, which means it reads past any row that is blocked. Normally you’d never use that, but in this case it’s exactly what we want. Because we don’t want to wait for that first lock (reading the message) to be released. We want to read messages, no matter how many locks are on the database. Nothing should be blocking the peek query.
So our assumption is that, even though you think you didn’t see it before, we think it did happen and it’s also perfectly normal. However, we’d need to know more about what is happening in code. That’s why we think a call would be better.
Let us know what your preference is, or if this answers your questions already.